My Thesis Results
Conservation in a Data Deficient World
Naturalists have studied the inhabitants of the natural world for eons - You might think by now we would know all the species large enough hold in your hand. But there are many we still don’t know anything about. Mosses especially. There are many species we don’t how to find or what they do. The danger is that we may never get a chance to find out. There are almost certainly many on the verge of extinction.
But how can you protect what you don’t recognize? Before we give up, I wanted to take a look at what we could figure out. My project uses what we do know, and generates some educated guesses about where best to save species.
Where are the best places to conserve moss species?
Where can we make the most difference to the survival of moss diversity for future generations? This is what I wanted to answer. There are several pieces needed to answer the question:
- Where are they?
- Which are at risk of extinction?
- Which play important roles in their ecosystems?
- Which are interesting and unique?
- Which can we save?
- Where can we do the most good?
Using thousands of recorded moss observations, I can map the habitat of all those species. Here are the locations with the highest moss diversity, according to my research. Of course, the more mosses in a given area, the more you protect at once if you dedicate the parcel to conservation.
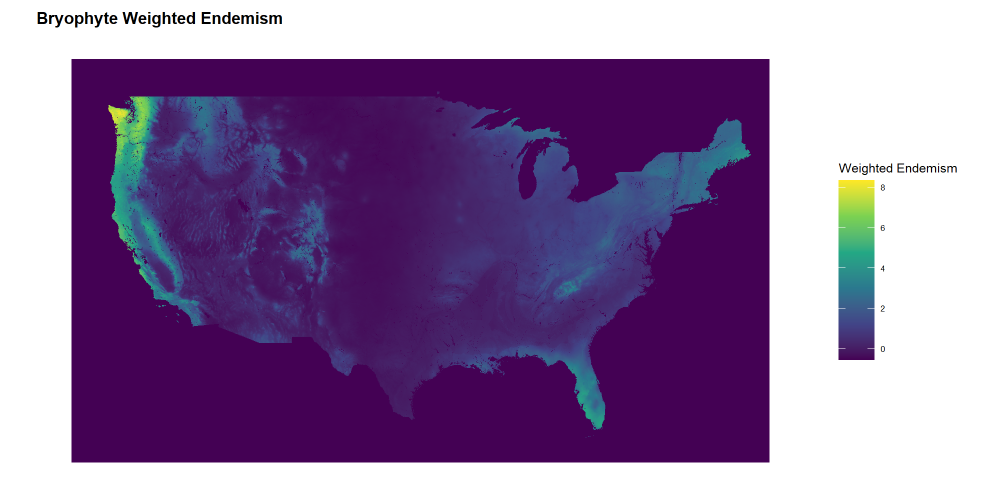
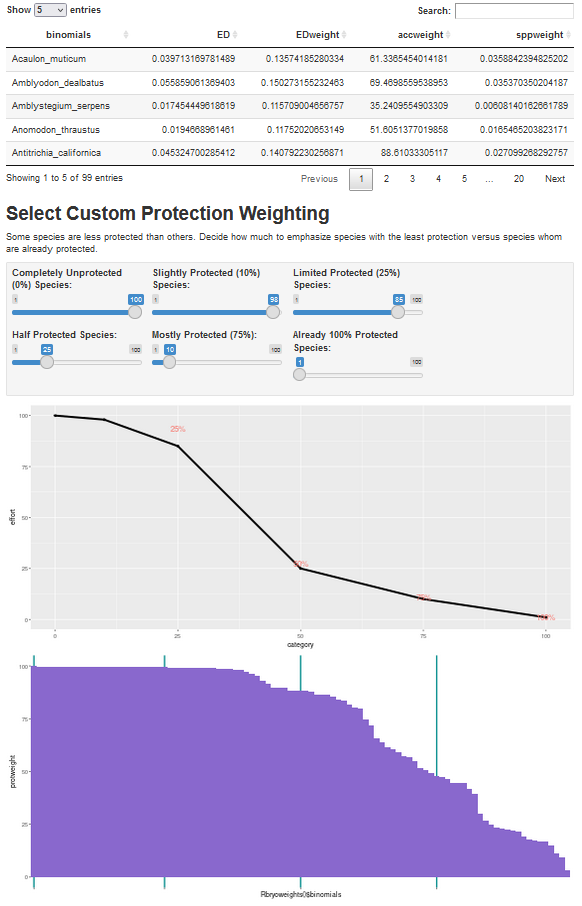
With all those individual species maps, I can compare which species habitats are already within conservation lands. The logic is that if a species is already primarily in protected regions, they are about as protected as they are liable to be at present. Eventually we might have the kinds of resources to monitor their populations, serve their needs, and mitigate threats to their survival, but that’s nowhere near possible at this time.
Right now, what we can do is identify places where lots of species with little protection occur in one place. These are places where we could achieve the most conservation for mosses in one act.
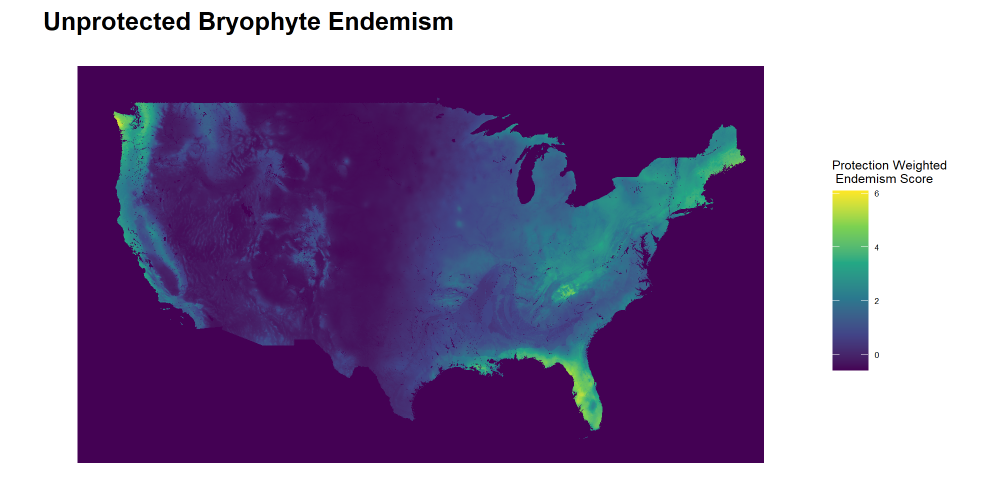
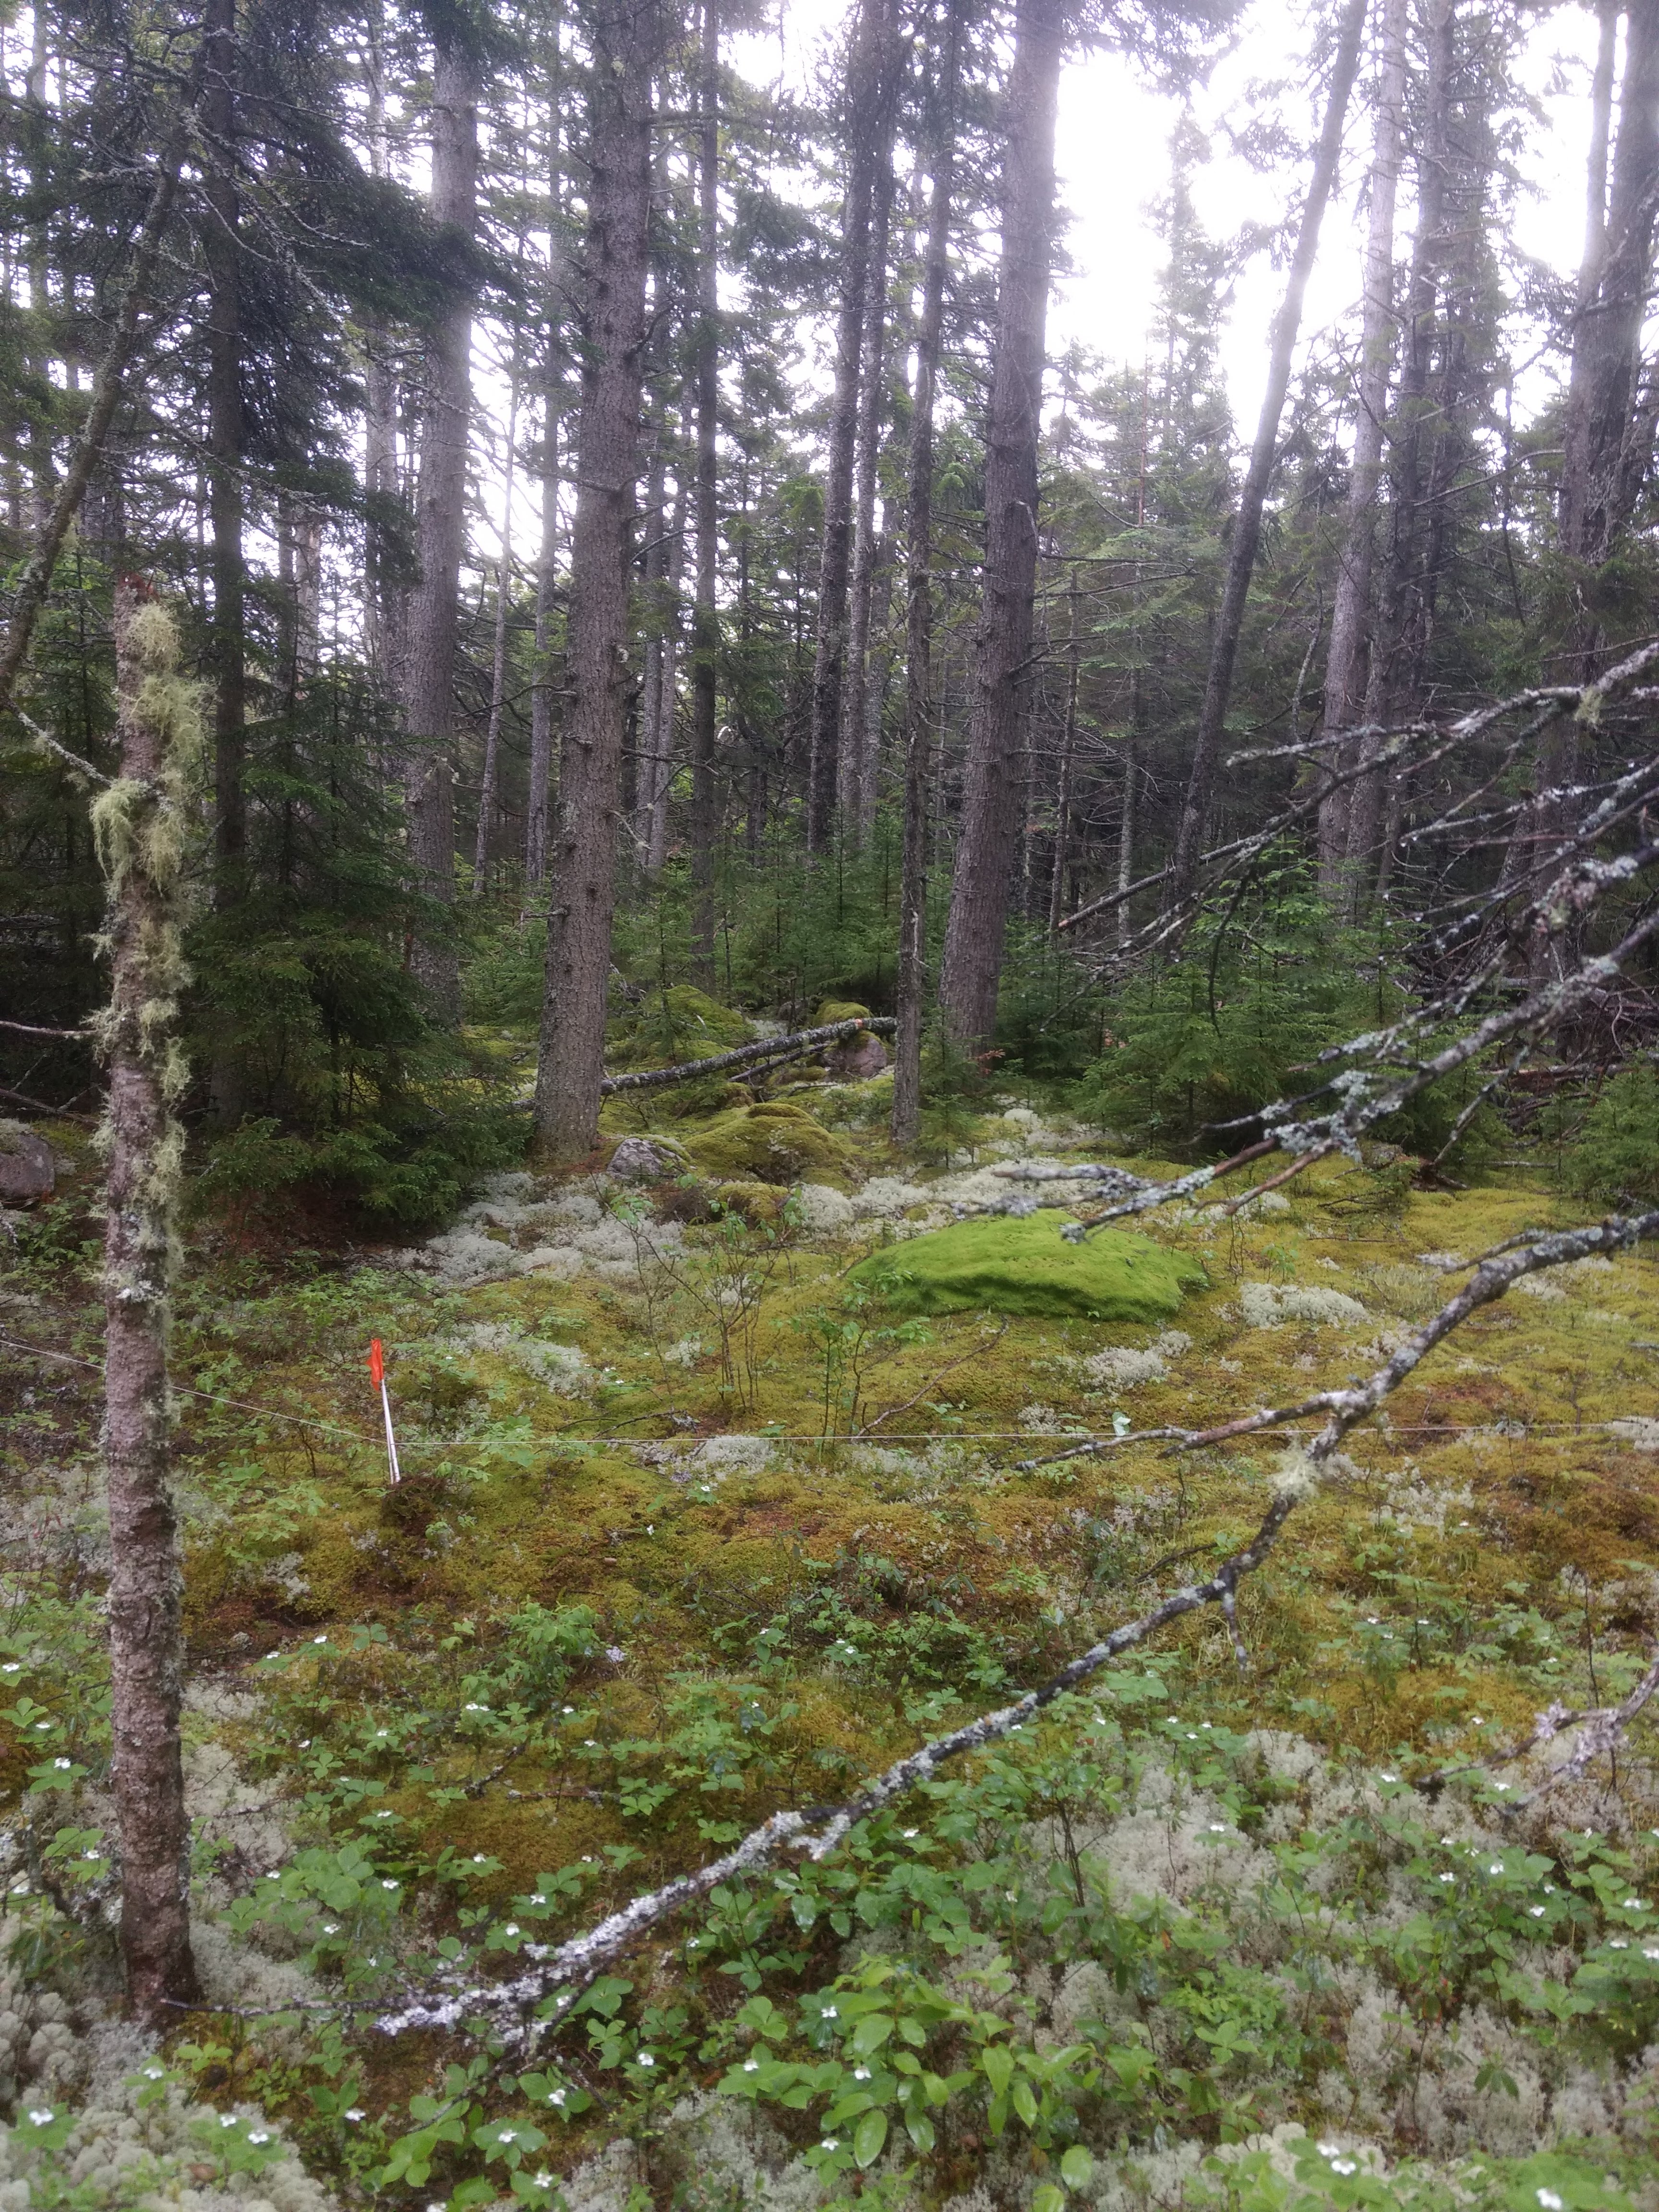
Also note that the smokey mountains are have lots of diversity, but Maine is not as diverse, despite their THICK moss carpets. (I mean just look at this place.)
Abundance isn’t the same as diversity.
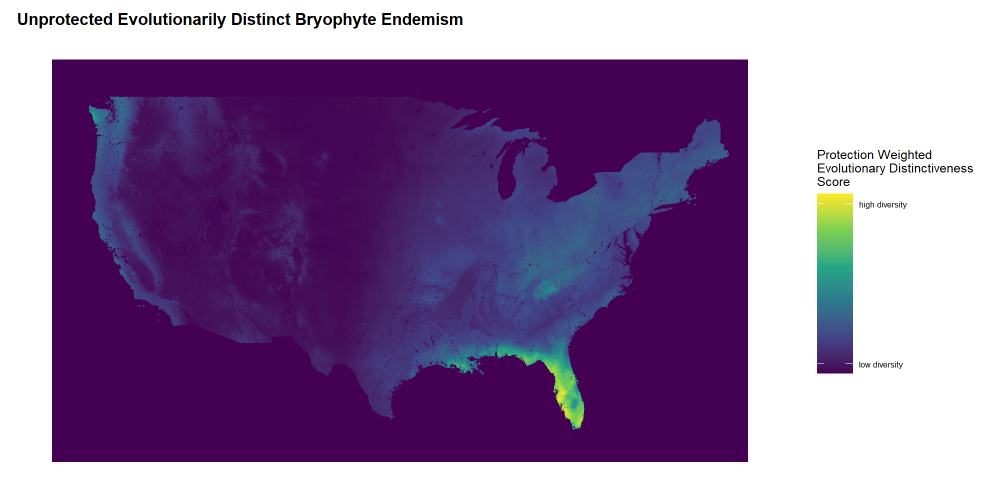
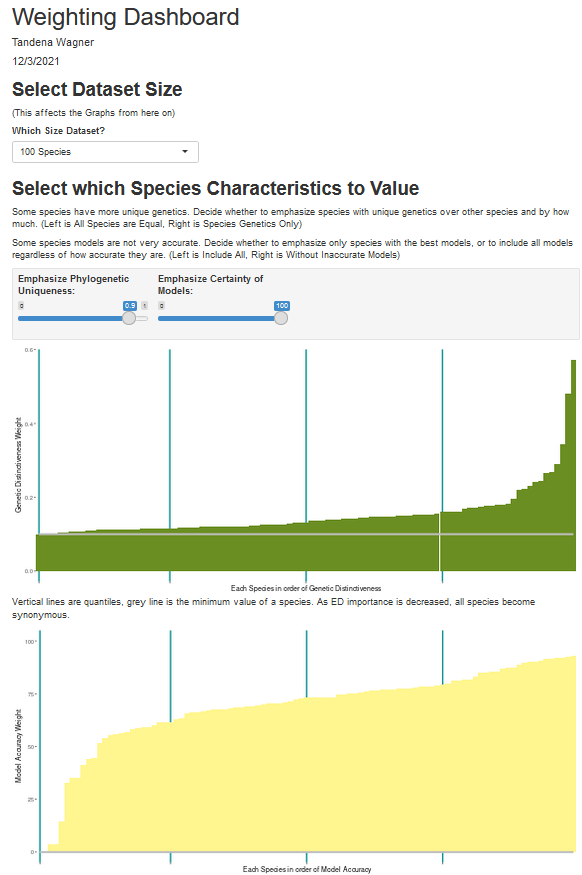
But isn’t there more to consider? What about the roles mosses play in their ecosystem? Species that are key to the environment are especially important. And what about unique, rare, and fascinating species? We’d do more to protect mosses that do incredible things more than we’d protect mosses that are largely identical to many others. Even if I had perfect data, these things are difficult to evaluate. Nonetheless, I think there are ways to get closer to such important factors. Species with uncommon genetics, known as “evolutionarily distinctive” are isolated on branches of the tree of life. Basically, species which are recently diverged (or have many close relatives) are somewhat less likely to be unique, and species which are the last of their kind (or have acquired a lot of genetic changes) are more likely to be unique. They might also be more important to their ecosystems, have more interesting traits, be less likely to go extinct, and a bunch of other important characteristics.1 But the support for these hopeful propositions is very tenuous.
Mainly: evolutionary distinctiveness is crude, but directionally correct. My goal is not to be accurate in any individual case, but to improve the hit rate across the board, at least until a targeted investigation can be made or else information becomes widely available. It’s an indicator.
It’s happening!
As a side effect, conserving evolutionary distinctiveness also conserves the evolutionary history of our planet. So that’s pretty important in it’s own right too.
But the locations of where the most difference can be made is very different from the locations for where we can actually make the most difference. I factored in cost to see where the most conservation could be achieved most cost effectively.
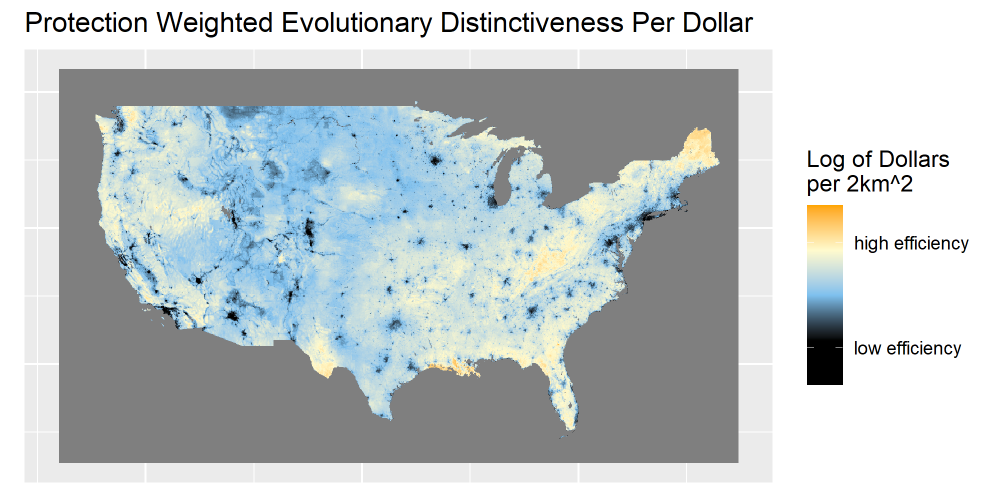
It makes a massive difference in outcome. Using the same budget could do 10 times as much good in cheaper places. Even if they weren’t the most prime locations, you could protect so much more area that it really made a big difference. This isn’t a sophisticated approach, because really you want to look at whether the act of conserving land changes anything. For example: if no one is going to develop land in southern Texas, than even though the most cost-effective biodiversity land is there, it might not be the most cost effective conservation impact. You could estimate that by looking at the land degradation, the speed of development, the effects of climate change, and many other interesting factors. But that will have to wait for another day.
What I did have time to do was look at how protecting the most important areas (not the most cost effective ones) would shift the importance of land. For example, if we protect some land it changes the map by changing which species are already in protected areas and which are not. Here is a little animation showing how the area to protect moves around when you add protection.
Yes I did calculate for the entire USA and no, there were no other places that showed up, even after protecting 2500km2 in 5 steps of 500km2 priority revision.
| _____________ | _____________ | |
|---|---|---|
|
|
You can explore all the data for yourself. Go to this dashboard and make your own maps. If you want to know what it looks like if protection doesn’t matter at all you can see for yourself. Or if you want to see where the MOST protected species are, it’s up to you. It has all my real data. (I recommend the 100-species version as it maps in 30 seconds.) |
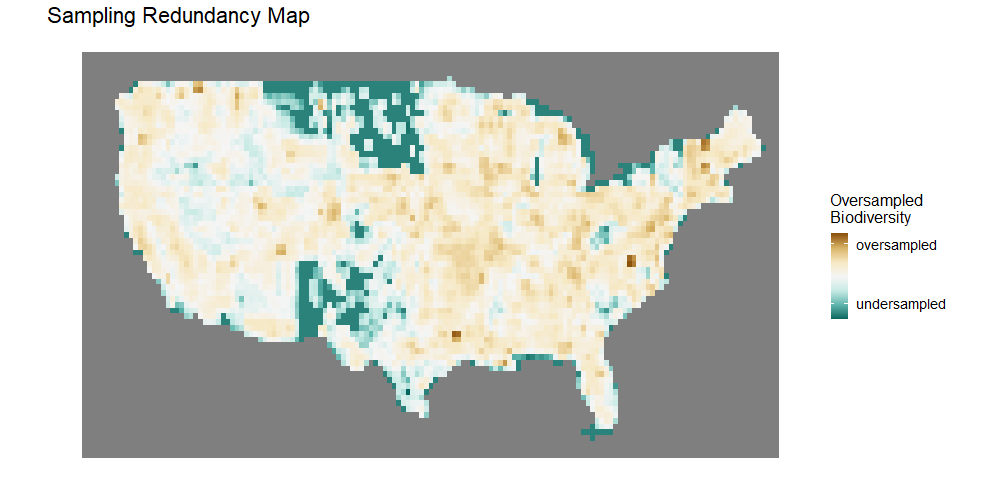
Another nice thing I was able to discover is that the United States isn’t undersampled really anywhere. My models didn’t seem biased by areas that were oversampled either.
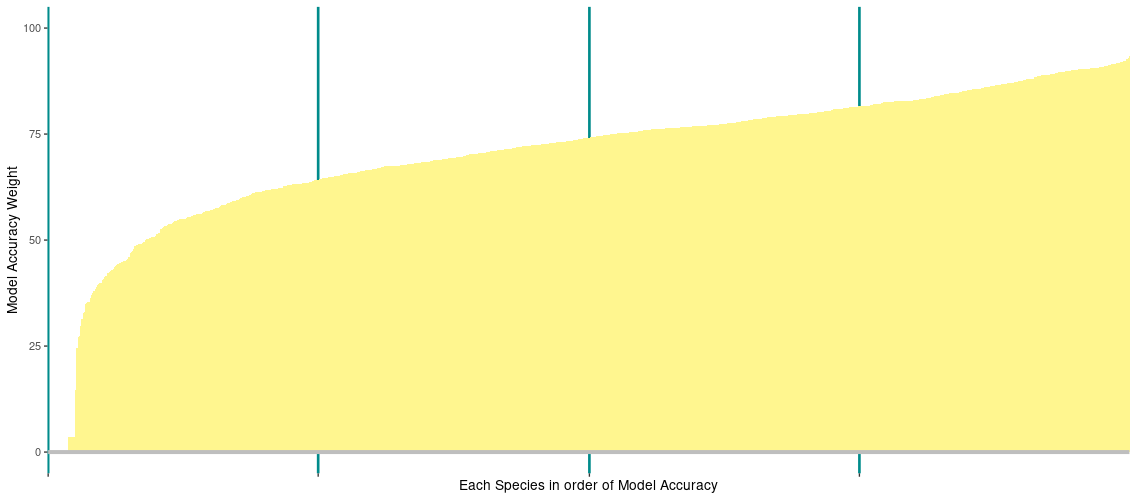
Most of my models seemed to perform quite well. Two thirds of my models have an AUC score of 9 or above which is considered “excellent.” A few other studies have considered above 0.6 “acceptable” and others removed all models with less than 0.7 indicating that 0.7 to 0.9 are acceptable AUC scores. Only 20 / 898 of my species had an AUC worse than 0.7. 3%. Not too shabby!
So that’s it! That’s what I have learned and the many different processes I went through to try and nail down where the best place to protect moss species is.
If you want to know why I started doing this project in the first place (and and old incorrect version of the map) you can read my description of my project here. Stay tuned for a step by step walkthrough of how I made this all happen, and the misadventures I had along the way!